
Who completed the most laps? Who set the fastest times? Who caused the most red flags? We have all the answers for you as we take a look at the statistics from F1’s 2019 pre-season testing!
REPORTS FROM EACH DAY
Before we delve into the numbers, here’s a summary of what happened on each day at testing. Click on a day to see the full report.
Day 1: Ferrari went furthest and fastest on the first day of testing in 2019, while Red Bull enjoyed a trouble-free first day with new engine partner Honda.
Day 2: Charles Leclerc set the fastest time of day two, while Mercedes completed the most laps and Pierre Gasly crashed out in the afternoon.
Day 3: Daniil Kvyat was the surprise pace-setter, Mercedes completed almost fifty more laps than any other team and Williams finally made it out on track.
Day 4: Nico Hulkenberg set the fastest lap on a day of limited running for Renault, while Antonio Giovinazzi and Alfa Romeo completed the most laps.
Day 5: Lando Norris set the fastest time, but McLaren, Mercedes and Ferrari all ran into trouble as testing resumed.
Day 6: McLaren set the pace for a second day in succession as a mechanical failure caused a crash for Sebastian Vettel and kept Ferrari off-track for most of the afternoon.
Day 7: Ferrari returned to the top of the timesheet with the fastest time seen so far, while Pierre Gasly suffered his second testing crash.
Day 8: Sebastian Vettel topped the timesheet as both Ferrari and Red Bull ended their testing programmes early after mechanical gremlins.
FASTEST TIME EACH DAY
Six different drivers set the fastest time of the day over the eight days of F1 testing, with the Ferrari pair being the only two to top the standings more than once.
Day |
Driver |
Lap Time |
Tyre |
1 |
Sebastian Vettel |
1:18.161 |
C3 |
2 |
Charles Leclerc |
1:18.247 |
C3 |
3 |
Daniil Kvyat |
1:17.704 |
C5 |
4 |
Nico Hulkenberg |
1:17.393 |
C5 |
5 |
Lando Norris |
1:17.709 |
C4 |
6 |
Carlos Sainz |
1:17.144 |
C4 |
7 |
Charles Leclerc |
1:16.231 |
C5 |
8 |
Sebastian Vettel |
1:16.221 |
C5 |
FASTEST SECTORS
The three fastest sector times seen over the eight days of testing were set by three different drivers:
Sector 1: 21.648 – Charles Leclerc (Day 7)
Sector 2: 28.221 – Sebastian Vettel (Day 8)
Sector 3: 25.992 – Lewis Hamilton (Day 8)
The lap time given from these three sector times added together is a 1:15.861, almost three tenths faster than the circuit’s track record set in qualifying for the 2018 Spanish Grand Prix.
RED FLAGS
There were 25 red flag periods over the eight days of winter testing. Williams were the only team to not cause a red flag. Alfa Romeo, Haas and McLaren caused the most, with five apiece. Here’s a run down of who caused red flags, and whether they were due to car issues (C) or driver error (D):
Alfa Romeo
- Day 1 – Raikkonen, off into gravel (D)
- Day 1 – Raikkonen stopped near Turn 1 (C)
- Day 4 – Giovinazzi stopped after pit exit (C)
- Day 4 – Giovinazzi stopped again a few minutes later (D)
- (Day 6 – Raikkonen stopped after chequered flag)
- Day 8 – Raikkonen stopped before Turn 3 (C)
Haas
- Day 1 – Grosjean, stopped at last chicane (C)
- Day 3 – Fittipaldi came to a halt (C)
- Day 3 – Grosjean stopped on track (C)
- Day 3 – Grosjean stopped… again (C)
- Day 8 – Magnussen stopped near Turn 3 (C)
McLaren
- Day 1 – Sainz stopped just beyond pit exit (C)
- Day 4 – Norris slow speed slide off track in cold temps (D)
- Day 5 – Norris stopped at Turn 4 (C)
- Day 5 – Norris stopped (C)
- Day 6 – Sainz stopped after pit exit (C)
Toro Rosso
- Day 2 – Albon into the gravel at Turn 4 (C)
Red Bull
- Day 2 – Gasly crashed at Turn 12 (D)
- Day 6 – Verstappen stopped near pit exit (C)
- Day 7 – Gasly crashed at Turn 9 (D)
Renault
- Day 4 – Hulkenberg stopped (C)
Mercedes
- Day 5 – Bottas stopped between turns 3 and 4 (C)
Ferrari
- Day 6 – Vettel crash at Turn 3 (C)
- Day 7 – Leclerc stopped before Turn 10 (C)
- Day 8 – Vettel stopped at turn 3 (C)
Racing Point
- Day 7 – Stroll stopped between Turns 9 and 10 (C)
FASTEST LAP FOR EACH DRIVER
Here’s the fastest lap set by each driver over the eight days of testing:
Driver |
Time |
Tyre |
Day |
|
1 |
Sebastian Vettel |
1:16.221 |
C5 |
Day 8 |
2 |
Lewis Hamilton |
1:16.224 |
C5 |
Day 8 |
3 |
Charles Leclerc |
1:16.231 |
C5 |
Day 7 |
4 |
Valtteri Bottas |
1:16.561 |
C5 |
Day 8 |
5 |
Nico Hulkenberg |
1:16.843 |
C5 |
Day 8 |
6 |
Alexander Albon |
1:16.882 |
C5 |
Day 7 |
7 |
Daniil Kvyat |
1:16.898 |
C5 |
Day 8 |
8 |
Carlos Sainz |
1:16.913 |
C5 |
Day 8 |
9 |
Romain Grosjean |
1:17.076 |
C5 |
Day 8 |
10 |
Lando Norris |
1:17.084 |
C5 |
Day 7 |
11 |
Pierre Gasly |
1:17.091 |
C5 |
Day 7 |
12 |
Daniel Ricciardo |
1:17.114 |
C5 |
Day 8 |
13 |
Kimi Raikkonen |
1:17.239 |
C5 |
Day 8 |
14 |
Lance Stroll |
1:17.556 |
C5 |
Day 7 |
15 |
Kevin Magnussen |
1:17.565 |
C5 |
Day 8 |
16 |
Antonio Giovinazzi |
1:17.639 |
C5 |
Day 7 |
17 |
Max Verstappen |
1:17.709 |
C3 |
Day 8 |
18 |
Sergio Perez |
1:17.791 |
C5 |
Day 8 |
19 |
George Russell |
1:18.130 |
C5 |
Day 7 |
20 |
Robert Kubica |
1:18.993 |
C5 |
Day 8 |
21 |
Pietro Fittipaldi |
1:19.249 |
C4 |
Day 3 |
FASTEST LAP FOR EACH TEAM
Here’s the fastest lap set by each team over the eight days of testing:
Team |
Time |
Tyre |
Day |
|
1 |
Ferrari |
1:16.221 |
C5 |
Day 8 |
2 |
Mercedes |
1:16.224 |
C5 |
Day 8 |
3 |
Renault |
1:16.843 |
C5 |
Day 8 |
4 |
Toro Rosso |
1:16.882 |
C5 |
Day 7 |
5 |
McLaren |
1:16.913 |
C5 |
Day 8 |
6 |
Haas |
1:17.076 |
C5 |
Day 8 |
7 |
Red Bull |
1:17.091 |
C5 |
Day 7 |
8 |
Alfa Romeo |
1:17.239 |
C5 |
Day 8 |
9 |
Racing Point |
1:17.556 |
C5 |
Day 7 |
10 |
Williams |
1:18.130 |
C5 |
Day 7 |
DRIVER LAP COUNT
Here’s how many laps each driver completed on each day of testing. An interactive chart can be found here.
Day 1 |
Day 2 |
Day 3 |
Day 4 |
Day 5 |
Day 6 |
Day 7 |
Day 8 |
Total |
|
Lewis Hamilton |
81 |
74 |
94 |
58 |
83 |
102 |
85 |
61 |
638 |
Valtteri Bottas |
69 |
89 |
88 |
57 |
7 |
74 |
97 |
71 |
552 |
Sebastian Vettel |
169 |
– |
134 |
– |
81 |
40 |
– |
110 |
534 |
Nico Hulkenberg |
66 |
95 |
63 |
24 |
80 |
58 |
73 |
51 |
510 |
Kimi Raikkonen |
114 |
– |
138 |
– |
– |
113 |
– |
132 |
497 |
Alexander Albon |
– |
132 |
– |
136 |
103 |
– |
118 |
– |
489 |
Carlos Sainz |
119 |
– |
90 |
– |
– |
130 |
– |
134 |
473 |
Charles Leclerc |
– |
157 |
– |
138 |
29 |
1 |
138 |
– |
463 |
Daniel Ricciardo |
44 |
28 |
80 |
34 |
77 |
72 |
65 |
52 |
452 |
Daniil Kvyat |
77 |
– |
137 |
– |
– |
101 |
– |
131 |
446 |
Pierre Gasly |
– |
92 |
– |
146 |
136 |
– |
65 |
– |
439 |
Antonio Giovinazzi |
– |
101 |
– |
154 |
99 |
– |
71 |
– |
425 |
Romain Grosjean |
65 |
– |
69 |
64 |
– |
120 |
16 |
73 |
407 |
Kevin Magnussen |
– |
59 |
– |
66 |
131 |
– |
53 |
94 |
403 |
Lando Norris |
– |
104 |
– |
132 |
80 |
– |
84 |
– |
400 |
Max Verstappen |
128 |
– |
109 |
– |
– |
128 |
– |
29 |
394 |
Lance Stroll |
– |
79 |
– |
72 |
82 |
– |
103 |
– |
336 |
George Russell |
– |
– |
23 |
17 |
119 |
– |
140 |
– |
299 |
Sergio Perez |
30 |
– |
67 |
– |
– |
88 |
– |
104 |
289 |
Robert Kubica |
– |
– |
– |
48 |
– |
130 |
– |
90 |
268 |
Pietro Fittipaldi |
– |
13 |
48 |
– |
– |
– |
– |
– |
61 |
TEAM LAP COUNT
Here’s how many laps each team completed on each day of testing. An interactive chart can be found here.
Day 1 |
Day 2 |
Day 3 |
Day 4 |
Day 5 |
Day 6 |
Day 7 |
Day 8 |
Total |
|
Mercedes |
150 |
163 |
182 |
115 |
90 |
176 |
182 |
132 |
1190 |
Ferrari |
169 |
157 |
134 |
138 |
110 |
41 |
138 |
110 |
997 |
Renault |
110 |
123 |
143 |
58 |
157 |
130 |
138 |
103 |
962 |
Toro Rosso |
77 |
132 |
137 |
136 |
103 |
101 |
118 |
131 |
935 |
Alfa Romeo |
114 |
101 |
138 |
154 |
99 |
113 |
71 |
132 |
922 |
McLaren |
119 |
104 |
90 |
132 |
80 |
130 |
84 |
134 |
873 |
Haas |
65 |
72 |
117 |
130 |
131 |
120 |
69 |
167 |
871 |
Red Bull |
128 |
92 |
109 |
146 |
136 |
128 |
65 |
29 |
833 |
Racing Point |
30 |
79 |
67 |
72 |
82 |
88 |
103 |
104 |
625 |
Williams |
– |
– |
23 |
65 |
119 |
130 |
140 |
90 |
567 |
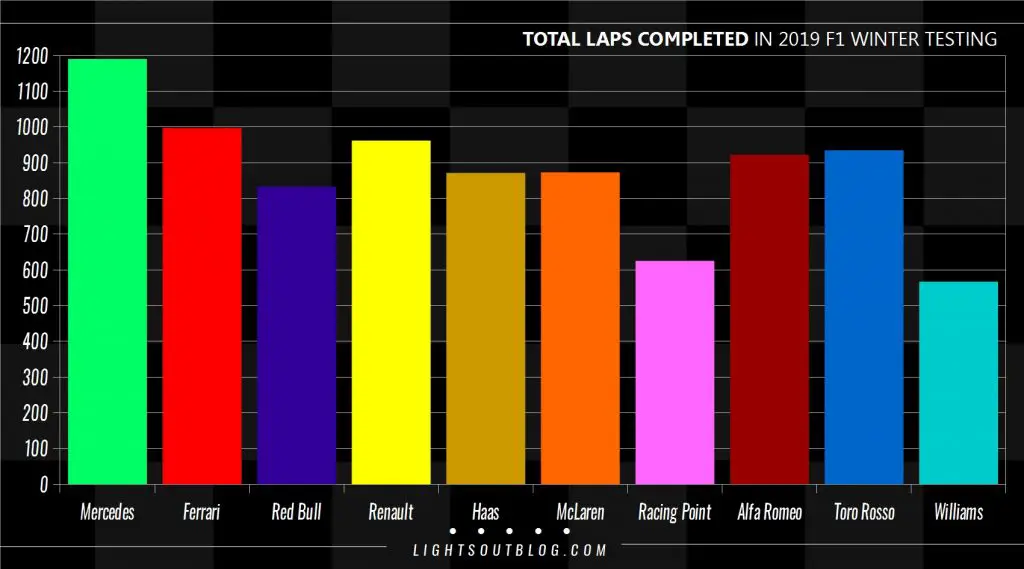
Here’s a visual representation of how many laps each team completed:
2018 LAPS VS 2019 LAPS
7,992 laps were completed over the two weeks of testing in 2018 – with a number of days in the first week being affected by poor weather conditions. 8,775 laps were completed over the eight days of the 2019 test. Here’s a comparison of how many laps each team did this year compared to in 2018:
2018 |
2019 |
Change |
% Change |
|
Mercedes |
1040 |
1190 |
150 |
14.42% |
Ferrari |
929 |
997 |
68 |
7.32% |
Toro Rosso |
835 |
935 |
100 |
11.98% |
Williams |
819 |
567 |
-252 |
-30.77% |
Renault |
795 |
962 |
167 |
21.01% |
Sauber |
786 |
922 |
136 |
17.30% |
Red Bull |
783 |
833 |
50 |
6.39% |
Force India |
711 |
625 |
-86 |
-12.10% |
Haas |
695 |
871 |
176 |
25.32% |
McLaren |
599 |
873 |
274 |
45.74% |